Weekly Practitioner Revenue Reporting
Automated weekly revenue reporting for two healthcare clinics on different practice-management platforms, delivering a per-practitioner leaderboard by email and maintaining a Google Sheet as the historical record. The engagement's defining problem was a revenue figure that came back roughly double the client's own: the source API can only filter invoices by update time, and taking a payment updates an invoice — so previously-billed work was being double-counted. The fix re-based the report on service date, parsed from line-item detail, and added runtime-budget guards so the workflow degrades visibly rather than timing out.
The problem
Clinic owners needed a weekly per-practitioner revenue view. Neither practice-management system could produce it in the required shape — and the two systems define revenue so differently that the same report had to be designed twice. On one platform, earned, invoiced and collected are the same number. On the other they are three genuinely independent streams that don't reconcile to each other, and the client cares about all three.
What was built
Two weekly workflows, one per client. Each computes its reporting window with correct local-midnight boundaries across DST, pulls its datasets, builds one row per practitioner, appends to an 18-column Google Sheet that acts as the historical record, reads it back, deduplicates for display, and emails an HTML leaderboard dashboard.
The hard part
The client checked the first invoiced figure against their own system. It was roughly twice too high.
Three candidate date bases, two of them wrong:
| Basis | Verdict |
|---|---|
| Update time — the only server-side filter available | Wrong. Taking a payment updates the invoice, so every old invoice paid this week counted as invoiced this week. |
| Issue date | Wrong. Editing or resending an invoice restamps it. |
| Service date | Correct — and not a field at all. It lives as free text inside each line item's description. |
So the filter moved into the workflow: fetch over a buffered update window, then count each line item only if the date parsed out of its description falls in the reporting week. A diagnostic counts how many items used the parsed date versus the fallback, because a regex over free text will eventually stop matching and that drift needs to be visible rather than silent.
That fix created a second problem — a symmetric three-week fetch blew past the platform's 60-second code-execution limit. The window became asymmetric and now-capped (2 days back, 14 forward), with a 52-second time budget that stops paging and returns partial data flagged as partial, rather than being killed at 60 seconds and producing nothing.
What can be verified
- Re-basing the report on service date removed roughly a 2× overstatement against the naive update-window basis
- Three candidate date bases were tested against the client's own figures before one proved stable
- A 52-second internal time budget against a 60-second platform limit returns flagged partial data rather than failing outright
- Retry helper on every API call: 3 retries, exponential backoff on 429, 30-second per-request timeout
The workflows
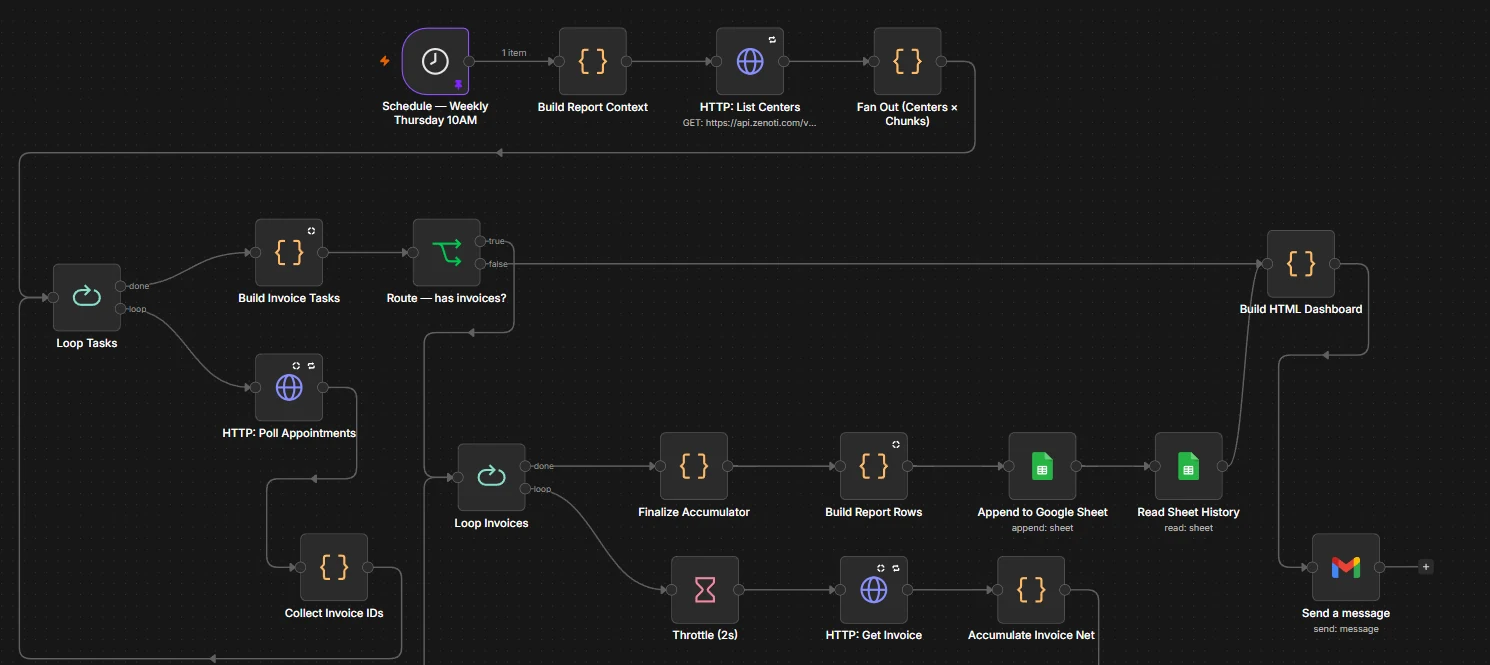 (select to enlarge)
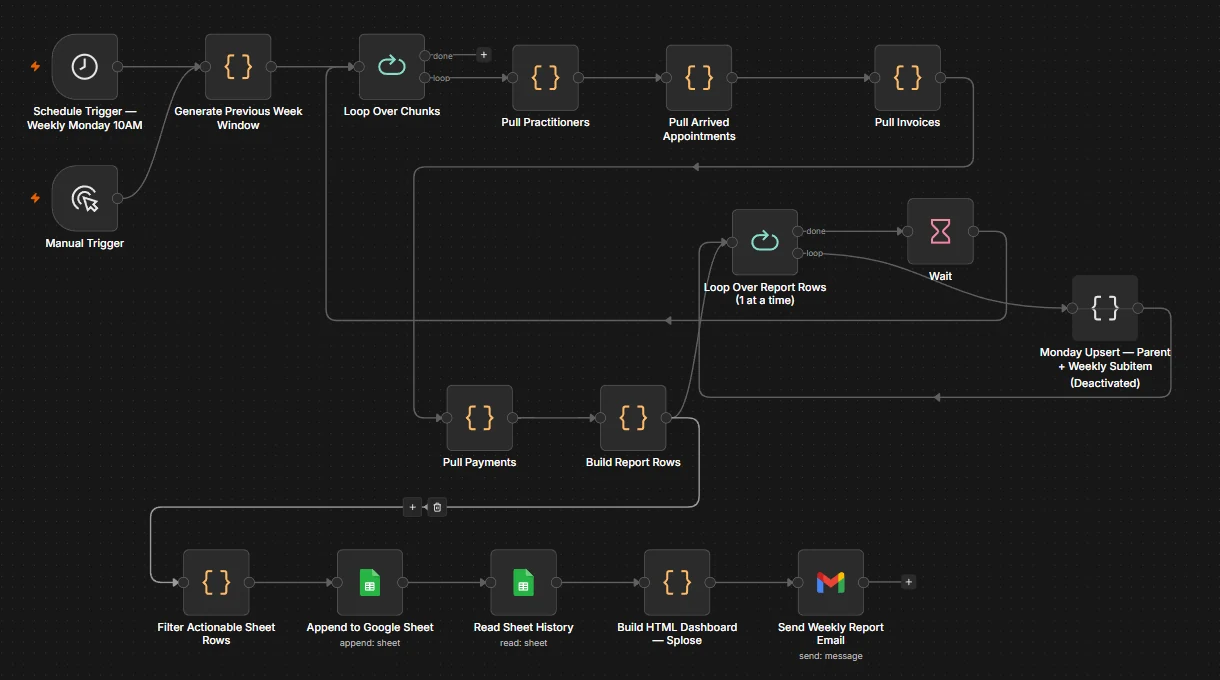 (select to enlarge)
On numbers: every figure above is an artefact count or a measured technical value. No business-outcome metric, whether time saved, revenue or conversion, was captured on these engagements, so none is claimed.
On status: reflects repository evidence and platform backups, not a live systems check.